


Census Tract 9572, Wabash County, Illinois
About
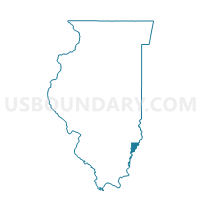
Outline

Summary
| Unique Area Identifier | 453468 |
| Name | Census Tract 9572 |
| County | Wabash County |
| State | Illinois |
| Area (square miles) | 203.74 |
| Land Area (square miles) | 200.51 |
| Water Area (square miles) | 3.23 |
| % of Land Area | 98.42 |
| % of Water Area | 1.58 |
| Latitude of the Internal Point | 38.44582090 |
| Longtitude of the Internal Point | -87.83916740 |
| Total Population | 3,921 |
| Total Housing Units | 1,790 |
| Total Households | 1,550 |
| Median Age | 41.8 |
Maps


Graphs
Select a template below for downloading or customizing gragh for Census Tract 9572, Wabash County, Illinois


Neighbors
Neighoring Census Tract (by Name) Neighboring Census Tract on the Map
- Census Tract 501, Gibson County, IN
- Census Tract 8808, Lawrence County, IL
- Census Tract 9559, Knox County, IN
- Census Tract 9569, Edwards County, IL
- Census Tract 9570, Edwards County, IL
- Census Tract 9573, Wabash County, IL
- Census Tract 9574, Wabash County, IL
- Census Tract 9575, Wabash County, IL
- Census Tract 9582, White County, IL
- Census Tract 9783, Richland County, IL
Top 10 Neighboring County Subdivision (by Population) Neighboring County Subdivision on the Map
- Vincennes township, Knox County, IN (23,707)
- Mount Carmel precinct, Wabash County, IL (8,389)
- Denison township, Lawrence County, IL (1,558)
- Gray township, White County, IL (1,141)
- French Creek precinct, Edwards County, IL (1,024)
- Wabash precinct, Wabash County, IL (1,007)
- Bellmont precinct, Wabash County, IL (702)
- Salem No. 1 precinct, Edwards County, IL (575)
- Lancaster precinct, Wabash County, IL (559)
- Friendsville precinct, Wabash County, IL (550)
Top 10 Neighboring Place (by Population) Neighboring Place on the Map
- Mount Carmel city, IL (7,284)
- Grayville city, IL (1,666)
- Allendale village, IL (475)
- Bellmont village, IL (276)
- Keensburg village, IL (210)
- Browns village, IL (134)
Top 10 Neighboring Unified School District (by Population) Neighboring Unified School District on the Map
- East Richland Community Unit School District 1, IL (14,052)
- South Gibson School Corporation, IN (12,317)
- Wabash Community Unit School District 348, IL (10,927)
- Red Hill Community Unit School District 10, IL (8,629)
- Lawrence County Community Unit District 20, IL (8,313)
- South Knox School Corporation, IN (6,205)
- Edwards County Community Unit School District 1, IL (5,982)
- Grayville Community Unit School District 1, IL (2,080)
- Allendale Community Consolidated School District 17, IL (1,020)
Top 10 Neighboring State Legislative District Lower Chamber (by Population) Neighboring State Legislative District Lower Chamber on the Map
- State House District 109, IL (103,405)
- State House District 108, IL (102,103)
- State House District 64, IN (60,833)
- State House District 76, IN (59,647)
Top 10 Neighboring State Legislative District Upper Chamber (by Population) Neighboring State Legislative District Upper Chamber on the Map
- State Senate District 55, IL (213,429)
- State Senate District 54, IL (204,199)
- State Senate District 48, IN (121,761)
- State Senate District 49, IN (113,960)
Top 10 Neighboring 111th Congressional District (by Population) Neighboring 111th Congressional District on the Map
- Congressional District 8, IN (694,398)
- Congressional District 15, IL (681,580)
- Congressional District 19, IL (672,930)
Top 10 Neighboring 5-Digit ZIP Code Tabulation Area (by Population) Neighboring 5-Digit ZIP Code Tabulation Area on the Map
- 47591, IN (26,770)
- 62863, IL (10,183)
- 62466, IL (4,848)
- 47665, IN (3,637)
- 62844, IL (2,083)
- 62476, IL (1,734)
- 62460, IL (1,231)
- 62410, IL (985)
- 47524, IN (605)
- 62815, IL (416)
Data
Demographic, Population, Households, and Housing Units
** Data sources from census 2010 **
Show Data on Map
Download Full List as CSV
Download Quick Sheet as CSV
| Subject | This Area | Wabash County | Illinois | National |
|---|---|---|---|---|
| POPULATION | ||||
| Total Population Map | 3,921 | 11,947 | 12,830,632 | 308,745,538 |
| POPULATION, HISPANIC OR LATINO ORIGIN | ||||
| Not Hispanic or Latino Map | 3,898 | 11,789 | 10,803,054 | 258,267,944 |
| Hispanic or Latino Map | 23 | 158 | 2,027,578 | 50,477,594 |
| POPULATION, RACE | ||||
| White alone Map | 3,856 | 11,576 | 9,177,877 | 223,553,265 |
| Black or African American alone Map | 10 | 77 | 1,866,414 | 38,929,319 |
| American Indian and Alaska Native alone Map | 7 | 21 | 43,963 | 2,932,248 |
| Asian alone Map | 4 | 70 | 586,934 | 14,674,252 |
| Native Hawaiian and Other Pacific Islander alone Map | 0 | 5 | 4,050 | 540,013 |
| Some Other Race alone Map | 5 | 62 | 861,412 | 19,107,368 |
| Two or More Races Map | 39 | 136 | 289,982 | 9,009,073 |
| POPULATION, SEX | ||||
| Male Map | 2,009 | 5,846 | 6,292,276 | 151,781,326 |
| Female Map | 1,912 | 6,101 | 6,538,356 | 156,964,212 |
| POPULATION, AGE (18 YEARS) | ||||
| 18 years and over Map | 3,015 | 9,299 | 9,701,453 | 234,564,071 |
| Under 18 years | 906 | 2,648 | 3,129,179 | 74,181,467 |
| POPULATION, AGE | ||||
| Under 5 years | 232 | 722 | 835,577 | 20,201,362 |
| 5 to 9 years | 246 | 723 | 859,405 | 20,348,657 |
| 10 to 14 years | 249 | 745 | 879,448 | 20,677,194 |
| 15 to 17 years | 179 | 458 | 554,749 | 12,954,254 |
| 18 and 19 years | 113 | 379 | 367,343 | 9,086,089 |
| 20 years | 33 | 156 | 179,613 | 4,519,129 |
| 21 years | 37 | 128 | 172,795 | 4,354,294 |
| 22 to 24 years | 100 | 343 | 526,556 | 12,712,576 |
| 25 to 29 years | 212 | 705 | 910,273 | 21,101,849 |
| 30 to 34 years | 230 | 661 | 865,684 | 19,962,099 |
| 35 to 39 years | 229 | 670 | 855,790 | 20,179,642 |
| 40 to 44 years | 217 | 669 | 870,100 | 20,890,964 |
| 45 to 49 years | 318 | 875 | 940,094 | 22,708,591 |
| 50 to 54 years | 331 | 949 | 930,785 | 22,298,125 |
| 55 to 59 years | 297 | 879 | 807,778 | 19,664,805 |
| 60 and 61 years | 133 | 355 | 284,180 | 7,113,727 |
| 62 to 64 years | 153 | 398 | 381,249 | 9,704,197 |
| 65 and 66 years | 77 | 226 | 205,270 | 5,319,902 |
| 67 to 69 years | 120 | 339 | 279,790 | 7,115,361 |
| 70 to 74 years | 150 | 465 | 364,475 | 9,278,166 |
| 75 to 79 years | 118 | 417 | 289,385 | 7,317,795 |
| 80 to 84 years | 88 | 326 | 235,381 | 5,743,327 |
| 85 years and over | 59 | 359 | 234,912 | 5,493,433 |
| MEDIAN AGE BY SEX | ||||
| Both sexes Map | 41.80 | 42.00 | 36.60 | 37.20 |
| Male Map | 41.60 | 40.40 | 35.20 | 35.80 |
| Female Map | 42.30 | 43.80 | 37.90 | 38.50 |
| HOUSEHOLDS | ||||
| Total Households Map | 1,550 | 5,012 | 4,836,972 | 116,716,292 |
| HOUSEHOLDS, HOUSEHOLD TYPE | ||||
| Family households: Map | 1,163 | 3,310 | 3,182,984 | 77,538,296 |
| Husband-wife family Map | 1,003 | 2,652 | 2,332,995 | 56,510,377 |
| Other family: Map | 160 | 658 | 849,989 | 21,027,919 |
| Male householder, no wife present Map | 62 | 191 | 227,684 | 5,777,570 |
| Female householder, no husband present Map | 98 | 467 | 622,305 | 15,250,349 |
| Nonfamily households: Map | 387 | 1,702 | 1,653,988 | 39,177,996 |
| Householder living alone Map | 345 | 1,473 | 1,346,312 | 31,204,909 |
| Householder not living alone Map | 42 | 229 | 307,676 | 7,973,087 |
| HOUSEHOLDS, HISPANIC OR LATINO ORIGIN OF HOUSEHOLDER | ||||
| Not Hispanic or Latino householder: Map | 1,545 | 4,968 | 4,329,737 | 103,254,926 |
| Hispanic or Latino householder: Map | 5 | 44 | 507,235 | 13,461,366 |
| HOUSEHOLDS, RACE OF HOUSEHOLDER | ||||
| Householder who is White alone | 1,532 | 4,900 | 3,680,912 | 89,754,352 |
| Householder who is Black or African American alone | 1 | 25 | 668,152 | 14,129,983 |
| Householder who is American Indian and Alaska Native alone | 1 | 10 | 13,449 | 939,707 |
| Householder who is Asian alone | 0 | 23 | 192,603 | 4,632,164 |
| Householder who is Native Hawaiian and Other Pacific Islander alone | 0 | 3 | 1,278 | 143,932 |
| Householder who is Some Other Race alone | 0 | 15 | 213,509 | 4,916,427 |
| Householder who is Two or More Races | 16 | 36 | 67,069 | 2,199,727 |
| HOUSEHOLDS, HOUSEHOLD TYPE BY HOUSEHOLD SIZE | ||||
| Family households: Map | 1,163 | 3,310 | 3,182,984 | 77,538,296 |
| 2-person household Map | 549 | 1,606 | 1,259,669 | 31,882,616 |
| 3-person household Map | 282 | 760 | 720,213 | 17,765,829 |
| 4-person household Map | 191 | 546 | 644,972 | 15,214,075 |
| 5-person household Map | 92 | 263 | 326,688 | 7,411,997 |
| 6-person household Map | 36 | 97 | 132,759 | 3,026,278 |
| 7-or-more-person household Map | 13 | 38 | 98,683 | 2,237,501 |
| Nonfamily households: Map | 387 | 1,702 | 1,653,988 | 39,177,996 |
| 1-person household Map | 345 | 1,473 | 1,346,312 | 31,204,909 |
| 2-person household Map | 35 | 191 | 250,239 | 6,360,012 |
| 3-person household Map | 5 | 19 | 36,254 | 992,156 |
| 4-person household Map | 2 | 13 | 14,759 | 411,171 |
| 5-person household Map | 0 | 6 | 3,959 | 126,634 |
| 6-person household Map | 0 | 0 | 1,433 | 48,421 |
| 7-or-more-person household Map | 0 | 0 | 1,032 | 34,693 |
| HOUSING UNITS | ||||
| Total Housing Units Map | 1,790 | 5,585 | 5,296,715 | 131,704,730 |
| HOUSING UNITS, OCCUPANCY STATUS | ||||
| Occupied Map | 1,550 | 5,012 | 4,836,972 | 116,716,292 |
| Vacant Map | 240 | 573 | 459,743 | 14,988,438 |
| HOUSING UNITS, OCCUPIED, TENURE | ||||
| Owned with a mortgage or a loan Map | 718 | 2,017 | 2,338,493 | 52,979,430 |
| Owned free and clear Map | 635 | 1,705 | 925,146 | 23,006,644 |
| Renter occupied Map | 197 | 1,290 | 1,573,333 | 40,730,218 |
| HOUSING UNITS, VACANT, VACANCY STATUS | ||||
| For rent Map | 29 | 103 | 158,882 | 4,137,567 |
| Rented, not occupied Map | 3 | 7 | 7,998 | 206,825 |
| For sale only Map | 12 | 63 | 82,739 | 1,896,796 |
| Sold, not occupied Map | 6 | 16 | 16,677 | 421,032 |
| For seasonal, recreational, or occasional use Map | 79 | 107 | 47,289 | 4,649,298 |
| For migrant workers Map | 0 | 0 | 315 | 24,161 |
| Other vacant Map | 111 | 277 | 145,843 | 3,652,759 |
| HOUSING UNITS, OCCUPIED, AVERAGE HOUSEHOLD SIZE BY TENURE | ||||
| Total: Map | 2.53 | 2.37 | 2.59 | 2.58 |
| Owner occupied Map | 2.53 | 2.46 | 2.69 | 2.65 |
| Renter occupied Map | 2.51 | 2.09 | 2.38 | 2.44 |
| HOUSING UNITS, OCCUPIED, TENURE BY RACE OF HOUSEHOLDER | ||||
| Owner occupied: Map | 1,353 | 3,722 | 3,263,639 | 75,986,074 |
| Householder who is White alone Map | 1,340 | 3,668 | 2,728,000 | 63,446,275 |
| Householder who is Black or African American alone Map | 1 | 7 | 272,489 | 6,261,464 |
| Householder who is American Indian and Alaska Native alone Map | 1 | 7 | 6,873 | 509,588 |
| Householder who is Asian alone Map | 0 | 14 | 118,649 | 2,688,861 |
| Householder who is Native Hawaiian and Other Pacific Islander alone Map | 0 | 1 | 644 | 61,911 |
| Householder who is Some Other Race alone Map | 0 | 3 | 103,641 | 1,975,817 |
| Householder who is Two or More Races Map | 11 | 22 | 33,343 | 1,042,158 |
| Renter occupied: Map | 197 | 1,290 | 1,573,333 | 40,730,218 |
| Householder who is White alone Map | 192 | 1,232 | 952,912 | 26,308,077 |
| Householder who is Black or African American alone Map | 0 | 18 | 395,663 | 7,868,519 |
| Householder who is American Indian and Alaska Native alone Map | 0 | 3 | 6,576 | 430,119 |
| Householder who is Asian alone Map | 0 | 9 | 73,954 | 1,943,303 |
| Householder who is Native Hawaiian and Other Pacific Islander alone Map | 0 | 2 | 634 | 82,021 |
| Householder who is Some Other Race alone Map | 0 | 12 | 109,868 | 2,940,610 |
| Householder who is Two or More Races Map | 5 | 14 | 33,726 | 1,157,569 |
| HOUSING UNITS, OCCUPIED, TENURE BY HISPANIC OR LATINO ORIGIN OF HOUSEHOLDER | ||||
| Owner occupied: Map | 1,353 | 3,722 | 3,263,639 | 75,986,074 |
| Not Hispanic or Latino householder Map | 1,348 | 3,705 | 2,996,581 | 69,617,625 |
| Hispanic or Latino householder Map | 5 | 17 | 267,058 | 6,368,449 |
| Renter occupied: Map | 197 | 1,290 | 1,573,333 | 40,730,218 |
| Not Hispanic or Latino householder Map | 197 | 1,263 | 1,333,156 | 33,637,301 |
| Hispanic or Latino householder Map | 0 | 27 | 240,177 | 7,092,917 |
| HOUSING UNITS, OCCUPIED, TENURE BY HOUSEHOLD SIZE | ||||
| Owner occupied: Map | 1,353 | 3,722 | 3,263,639 | 75,986,074 |
| 1-person household Map | 290 | 889 | 732,688 | 16,453,569 |
| 2-person household Map | 520 | 1,451 | 1,111,442 | 27,618,605 |
| 3-person household Map | 252 | 625 | 529,763 | 12,517,563 |
| 4-person household Map | 174 | 437 | 493,300 | 10,998,793 |
| 5-person household Map | 76 | 213 | 238,851 | 5,057,765 |
| 6-person household Map | 30 | 79 | 92,193 | 1,965,796 |
| 7-or-more-person household Map | 11 | 28 | 65,402 | 1,373,983 |
| Renter occupied: Map | 197 | 1,290 | 1,573,333 | 40,730,218 |
| 1-person household Map | 55 | 584 | 613,624 | 14,751,340 |
| 2-person household Map | 64 | 346 | 398,466 | 10,624,023 |
| 3-person household Map | 35 | 154 | 226,704 | 6,240,422 |
| 4-person household Map | 19 | 122 | 166,431 | 4,626,453 |
| 5-person household Map | 16 | 56 | 91,796 | 2,480,866 |
| 6-person household Map | 6 | 18 | 41,999 | 1,108,903 |
| 7-or-more-person household Map | 2 | 10 | 34,313 | 898,211 |
Loading...